This is part 2 of 3 parts series in which we will try and explain what is TV Analytics, methods to Base Line Corrections and related use cases of TV analytics.
Just like in MasterChef, each TV analytics solution has its own secret recipe. At SYNC, our credo is transparency: no black box and baseline correction.
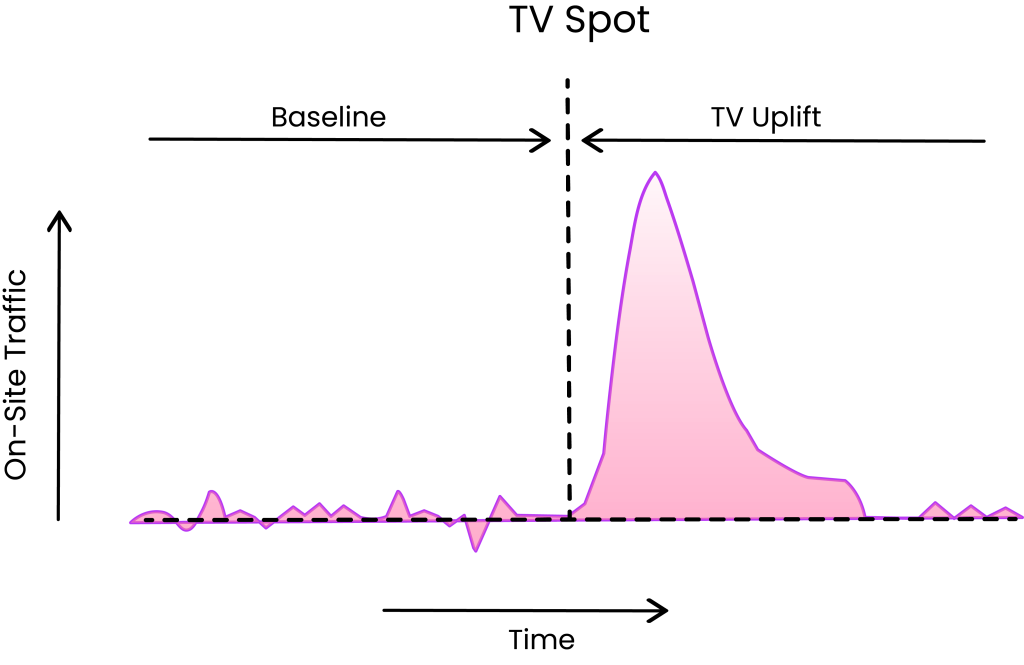
The Common Concept: The most common approach of baseline subtraction to measure additional TV-induced on-site traffic presumes the following scenario:
The baseline is established by looking at historical traffic data on the advertiser’s website or application before the TV spot is broadcasted. This baseline represents the expected level of traffic during the same time period if the TV spot was not aired. Any increase in traffic above this baseline during and after the TV spot is aired can be attributed to the TV spot’s impact.
But then it soon starts to distort the results:
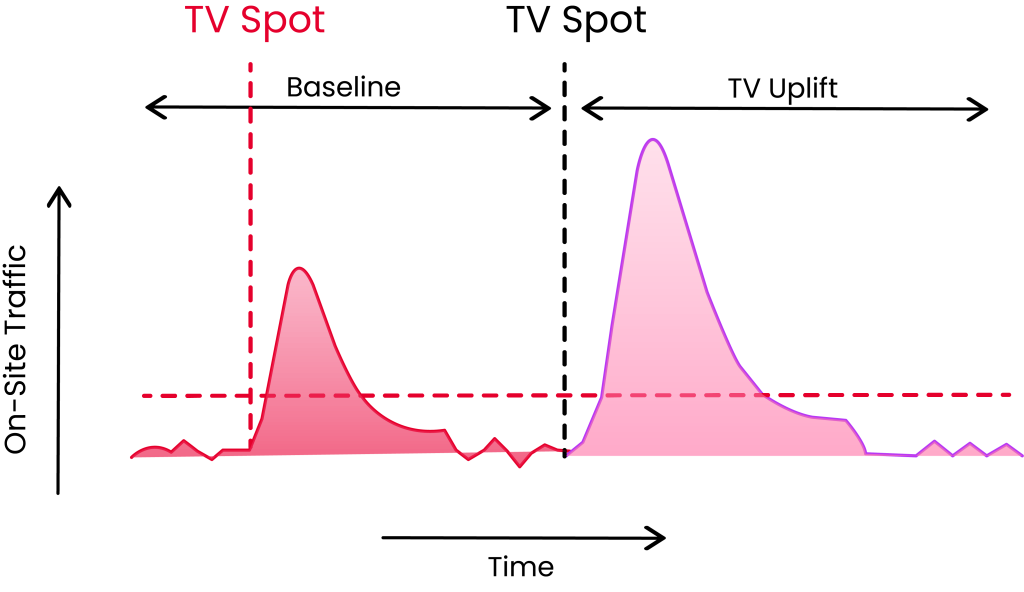
For instance, when multiple TV commercials are aired close in time, the uplifts computed via baseline subtraction are skewed. For instance, the baseline will be overestimated and the uplift of the spot that follows will be underestimated if another spot-induced uplift occurs during the timeframe scheduled for baseline determination.
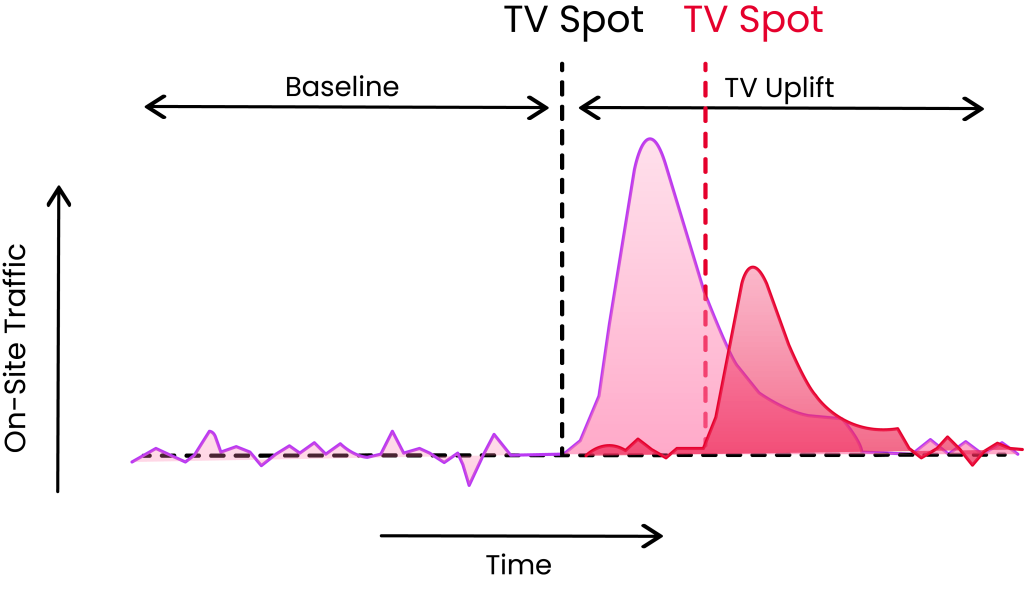
Or the temporal overlay of the uplift of two spots can cause problems when using the baseline subtraction method to measure the uplift of each spot. This is because the method assumes that the uplift observed during a certain time period is due to a specific TV spot and not any other factor. However, if two TV spots air close together, it can be difficult to separate their individual contributions to the observed uplift. This can result in inaccurate estimates of the uplift of each spot.
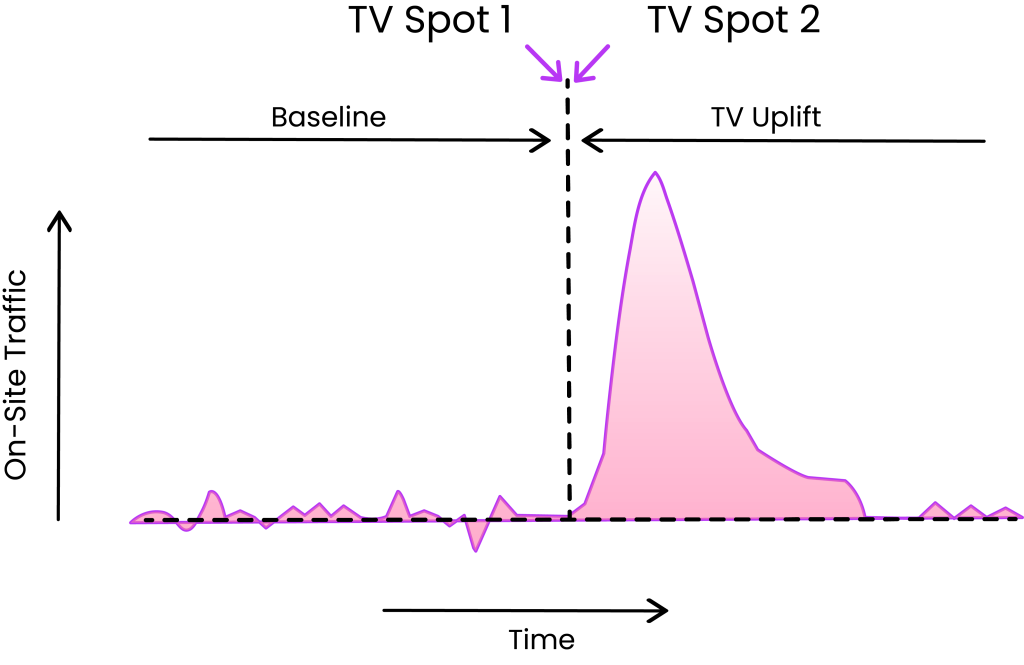
Also another challenge for the determination of the spot-specific uplift occurs when brand advertisement is broadcasted on different TV stations at the same time. The uplift observed after the broadcast can no longer easily be assigned to the responsible spot.
Most measurement companies and in-house teams overcome the last two concerns by using information on the reach of the spot concerned. In concrete terms, the uplift that cannot be clearly attributed to a specific spot is assigned in the ratio of each spot’s reach.
However, our statistical data from over 1000s of campaigns from digital-first clients measured on SYNC OS demonstrate, that the observed uplift of non-overlapping spots can only be explained to a minor amount (15% to 20%) by the spot’s reach, implying that such a resolve is far from ideal.
When we look at the client’s data we serve, the uplift typically spans 5 to 15 minutes. 50% to 70% of the emitted spots are broadcasted in a time interval of less than 10 minutes. This means that for more than half of the spots emitted – using the simple baseline correction – incorrect uplifts would have been calculated.
That is why SYNC OS uses multi-level statistical procedures to ensure undistorted quantification of the TV impact. To do so, we deploy following steps:
Step I: Identifying Relevant Online Channels
Before we even begin with the analysis, online channels with statistically significant TV-induced traffic are identified. This upstream step eliminates the need to identify the extent to which particular channels are important for TV analysis at all. The data collected is used to answer this question.
Step II: Undistorted Baseline Measurement
The baseline is modelled in the context of a multiple regression, taking into consideration possible upstream TV uplifts, so that it may be estimated apart from the TV-induced traffic and utilised as an undistorted measure in the future analysis phases.
Step III: Uplift Shape Analysis
The systematic timing and duration of the TV uplift may be determined independently for each online channel and can be limited to meaningful time periods for further analysis with the undistorted separation of baseline and TV-induced traffic from Step II.
Step IV – Shape Pattern Recognition
Shape Pattern Pattern Recognition, which enables the accurate segmentation of overlapping TV uplifts into the contribution of each spot, is founded on the baseline corrected TV uplift time series.
Step V – Predictive Impact Modelling
The methods utilised in stages 1 through 4 are based on the difference in time between the broadcasts of TV advertisements. When commercials are shown simultaneously on many TV stations, this separation is no longer possible. To establish a prognosis for the uplift of the spots based on the characteristics of the concurrently emitted spots, and to use them for further study, a thorough statistical modelling of the already-identified uplift is available. The explanatory power of the models increases to 70% or even 80% due to the fact that such thorough modelling accounts for not only spot reaches (see above), but also saturation effects, TV channels, hours, days of the week, etc.
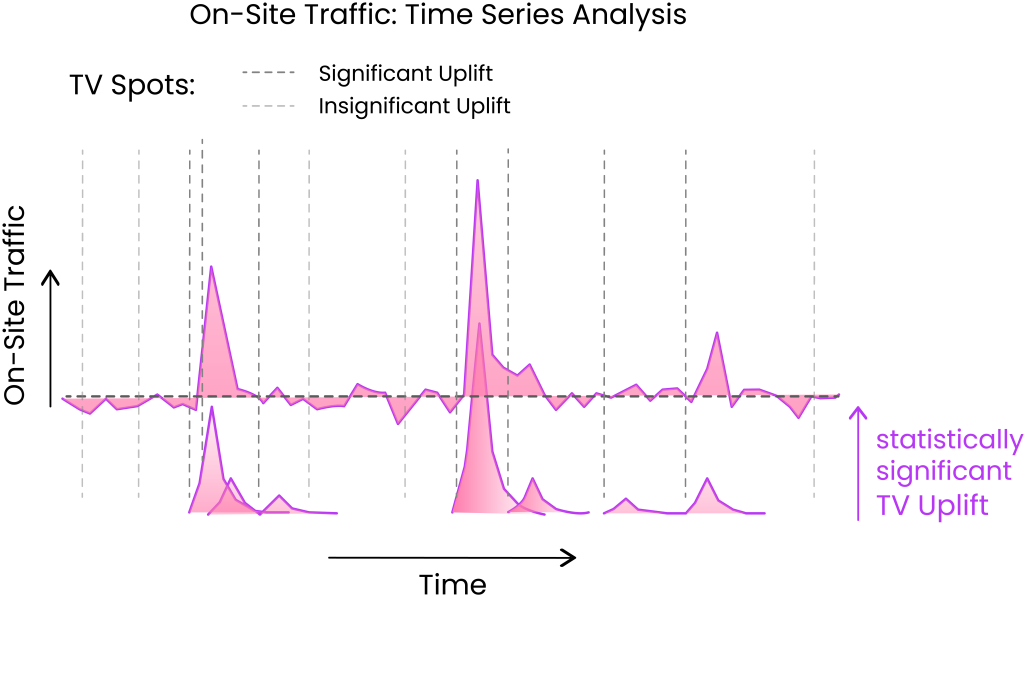
So What Does the Result of a Correspondingly Comprehensive Analysis Look Like?
The explanatory power of the model is a measure of how well the model fits the observed data, and it is expressed as the proportion of the variation in the data that is explained by the model. An explanatory power of 85% or more indicates that the model is a good fit for the data and that it can reliably measure the TV effect. This approach allows advertisers to have a comprehensive understanding of the impact of their TV campaigns on website traffic and user behavior.
This assessment provides data on whether an increase in traffic following the airing of a TV commercial may be regarded as a random fluctuation or a statistically meaningful uplift.When there is a significant uplift in on-site traffic and the uplift can be clearly assigned to specific TV spots without temporal overlap, the contribution of each spot to the uplift can be identified and quantified. This allows advertisers to better understand the individual impact of each TV spot and optimize their media plan accordingly.
Using the Results for Optimising the Impact of TV Advertising
To effectively assess the impact of individual advertising spots, it is important to consider the increase in traffic they generate in relation to the cost of broadcasting those spots. This comparison can be made based on modeling results, which allow for an evaluation of each spot’s effectiveness. Additionally, to accurately measure the return on investment of advertising efforts, it is necessary to account for the short-term TV uplift generated by these spots and identify TV as an additional advertising channel in the attribution results. This approach ensures that the true value of TV advertising is accurately reflected in the cost-benefit analysis.
To accurately determine the impact of TV advertising on website traffic and subsequent purchase decisions, two attribution shares must be calculated:
First, the prevailing TV ratio for each user’s website visit must be determined, representing the probability that the traffic was induced by TV advertising. This ratio is always 0 for online channels that do not experience significant TV uplift. It is important to note that while the TV uplift can be measured at an aggregate level, it cannot be separated from individual baseline traffic.
Secondly, the proportional impact of each individual touchpoint, such as website visits, on the purchase decision must be calculated for every successful customer journey. By evaluating each touchpoint in the customer journey, the contribution of TV advertising to the final purchase decision can be accurately assessed. These attribution shares allow for a more comprehensive analysis of the effectiveness of TV advertising in driving website traffic and sales.
By combining the two attribution shares, the sales that can be directly attributed to the TV spot can be calculated, allowing for an evaluation of the TV spot’s contribution to individual sales. Aggregating all sales provides a spot-specific short-term attribution share, which considers TV’s impact not only as the final touchpoint in the customer journey, but also as the initiator of the journey and as an assist in the decision-making process. This approach provides a more holistic assessment of the TV spot’s effectiveness and considers its contribution throughout the entire customer journey.
Conclusion
The approach SYNC OS deploys to strengthen the baseline approach, which is prone to errors, and mitigates potential measurement errors associated with simple baseline subtraction. Furthermore, it enables advertisers to analyze changes in on-site traffic and distinguish between statistically significant TV uplift and random fluctuations. This allows for cost-benefit analyses to be conducted on a statistically valid basis, providing more accurate insights into the impact of TV advertising on website traffic and sales. By using this approach, advertisers can make more informed decisions about their advertising strategies and optimize their return on investment.
Leave a Reply